| X | |||||
|
X
ETF - Market Timing Service  Premium Stocks Service 
|
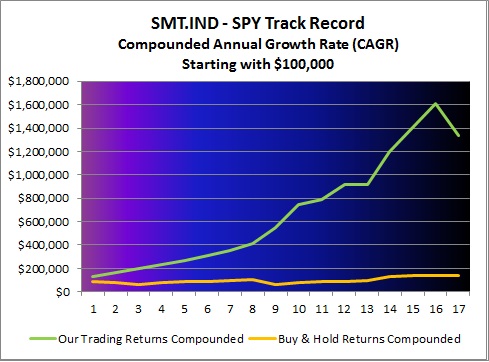
(SPDR Trust Series I) Our performance is independently verified by Alpha Performance Verification Services, TimerTrac.com, On our front page below the "Arithmetic Computation of our Returns" view the latest returns of our SMT.IND and SMT.EOD Systems. The Compounded Annual Growth Rate is abbreviated as CAGR. SMT.IND System (Intraday, Year 2000 - Present):
Arithmetic Computation Individual Trades (Year 2017):
(Excel, PDF) SMT.EOD System (End-of-Day, Year 2003 - Present):
CAGR Individual Trades (Year 2003 - Present) (Excel, PDF)
 If your current trading style has not matched our performance over the last several years, Results are based on the price when each new signal was produced.
Copyright © 2000 - 2017 StockMarketTiming.com, LLC. All rights reserved. |
X | |||
| X | |||||